Search the Community
Showing results for tags 'tool'.
Found 3 results
-
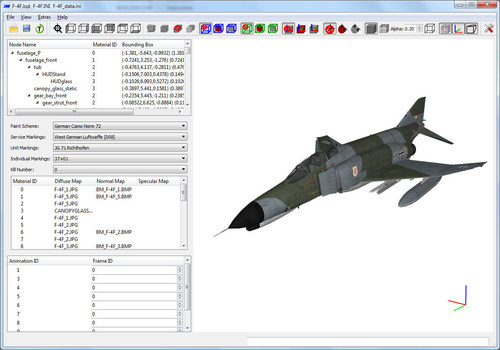
View File LODViewer This is the newest version of the LODViewer. New features: -decal support -display of collision and pivot points -added transparency and wireframe display mode -user definable background color -view manipulation via keyboard -64 bit application -uses the OpenSceneGraph library and Qt 5.9.5 Install instructions: Extract the content of the zip package to a convenient location. The LODViewer depends on the Microsoft Visual Studio 2017 C++ libraries. If not already installed on the computer (e.g. by other applications) it has to be installed by running vcredist_x64.exe (you can find it in the redist subfolder of this package). Have fun! And report bugs Mue Submitter mue Submitted 06/06/2019 Category Utilities / Editors
- 79 replies
-
- 10
-

-

-
Version 0.6.3
1,646 downloads
This is the newest version of the LODViewer. New features: -decal support -display of collision and pivot points -added transparency and wireframe display mode -user definable background color -view manipulation via keyboard -64 bit application -uses the OpenSceneGraph library and Qt 5.9.5 Install instructions: Extract the content of the zip package to a convenient location. The LODViewer depends on the Microsoft Visual Studio 2017 C++ libraries. If not already installed on the computer (e.g. by other applications) it has to be installed by running vcredist_x64.exe (you can find it in the redist subfolder of this package). Have fun! And report bugs Update 29.03.2025: I think it's best for the community if my tools are freely downloadable for everyone. External download link: https://www.dropbox.com/scl/fi/a4ah52r9gb2cm3rwhi3iz/LODViewer-0.6.3.zip?rlkey=e1l9jlvagiroyoc88xy5jahr3&st=si329dc9&dl=0 Mue -
Debug HUD Extractor
mue posted a topic in Thirdwire: Strike Fighters 2 Series - Mods & Skinning Discussion
Maybe some of the flight model guys find this useful for creating, analyzing or checking flight models. Last year I had the idea for a tool that extracts the data of the debug hud and writes them into a text file: (from this post: https://combatace.com/forums/topic/91675-how-to-develop-test-flight-models/?do=findComment&comment=741238): The process steps are illustrated in the following figure: The tool "DebugHUDExtractor" I came up with is written in python and uses the optical character recognition (OCR) software tesseract. Thus to use the DebugHudExtractor you have to install python, some python packages and the tesseract software. For those who want to try this tool, here are the installation, configuration and usage instructions: 1.) Download and install tesseract: https://digi.bib.uni-mannheim.de/tesseract/tesseract-ocr-w64-setup-v4.1.0.20190314.exe Copy lucidaconsole.traineddata into tessdata directory (e.g. C:\Program Files\Tesseract-OCR\tessdata). Needs admin rights. This file contains the trained data for the lucida console font. I use this font as it gave me the best results with the character recognition. This font has to be configured for the debug hud output in the game (see. step 4 below) 2.a) Download and install python: https://www.python.org/ftp/python/3.7.3/python-3.7.3-amd64.exe While installing select "Customize installation": -optional: change the installation directory (e.g I use C:\Python37) -enable "Add Python to environment variables" 2.b) Install needed python packages. On the windows command line execute the following commands: pip install pillow pip install numpy pip install opencv-python pip install pytesseract 3.) Setting the path to the tesseract executable: In <Python_install_directory>\Lib\site-packages\pytesseract\pytesseract.py (line 35) set tesseract_cmd to the file path of the tesseract executable. Use double backslashes or normal slashes. E.g.: tesseract_cmd = 'C:\\Program Files\\Tesseract-OCR\\tesseract' 4.) Configure the game. In SF2/FE2 game set Option Hud = Normal and configure the Huddata.ini. It enables the debug hud, set the font to lucida console, sets a bigger font size (the bigger the better, but all relevant debug info should still be displayed in the screen,e.g. for my 1920x1080 resolution I use TextSize = 24) ,the normal font color is changed to red (required for text filtering), the default right info box is disabled and the default left aircraft info box is moved to the right (that gives more space for the debug info box on the left) [Debug] DisplayDebug=true [Font] TextFontName=Lucida Console TextSize=24 [InfoDisplay] //BackgroundImage=TextBackground.tga BottomLeftPosition=0.8,1.0 //BottomRightPosition=0.99,0.985 NormalColor=1.0,0.0,0.0,1.0 5.) Configure the python script debughudextractor.py : Depending on the values you want to extract from the debug hud the variables extractPitch, extractAlpha, ... have to be set to True or False, The leftRect and rightRect variables have to be configured depending on where the debug info box and aircraft info box is located on your screen (depending on your screen resolution and the entries in your huddate.ini) The format is as follows: leftRect = (top-left-x, top-left-y, bottom-right-x, bottom-right-y) The top left corner of the screen is the origin (0,0). E.g. with a resolution of 1920x1080 and the above huddata.ini, I use the following: leftRect = (56,236,1450,1080) rightRect = (1528,968,1920,1080) See this picture: 6.) Start the script from windows command line: python debughudextractor.py video_file_path time_step_in_s start_time_in_s end_time_in_s <video_file_name>.txt and <video_file_name>_error.txt will be written into the directory of the video file. <video_file_name>.txt contains the extracted data. <video_file_name>_error.txt contains what values at what time couldn't be recognized. If a value couldn't be recognized, then the very next video frame is used and analyzed.

